Limit of a function does not necessarily exists. Possible cases of non-existing limits would be when
- at least one of the one-sided limits does not exist;
- both one-sided limits exist but they are not the same.
Here are a couple of examples of non-existing limits.
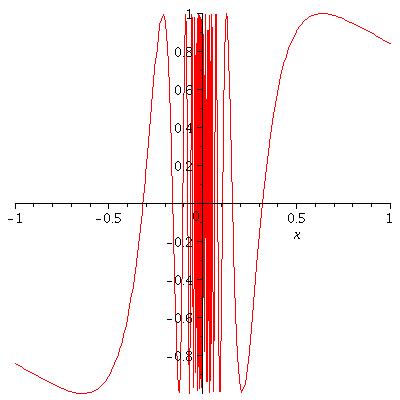
Example. Let \(f(x)\) be the function defined by \(f(x)=\sin\frac{1}{x}\) for \(x\ne 0\). The graph of this function is given by

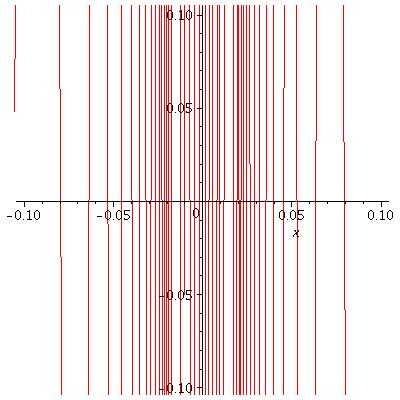
As \(x\) approaches to \(0\), \(\sin\frac{1}{x}\) keeps oscillating near the \(y\)-axis but it does not approach to anywhere. This is the case when neither \(\lim_{x\to 0-}\sin\frac{1}{x}\) nor \(\lim_{x\to 0+}\sin\frac{1}{x}\) exists. The following picture shows you a closer look at the graph near the \(y\)-axis.

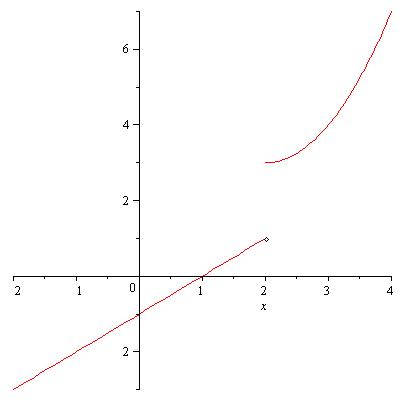
Example. Let \(f(x)\) be the function defined by \[f(x)=\left\{\begin{array}{ccc}x-1 & {\rm if} & x<2\\(x-2)^2+3 & {\rm if} & x\geq 2.\end{array}\right.\] The graph of \(f(x)\) is

Let us calculate the left-hand and the right-hand limit of \(f(x)\) at \(x=2\): \begin{eqnarray*}\lim_{x\to 2-}f(x)&=&\lim_{x\to 2-}(x-1)\\&=&1,\\\lim_{x\to 2+}f(x)&=&\lim_{x\to 2+}(x-2)^2+3\\&=&3.\end{eqnarray*} Both the left-hand and the right-hand limits of \(f(x)\) exist, however they do not coincide. Hence the limit \(\lim_{x\to 2}f(x)\) does not exist.

Pingback: The Precise Definition of a Limit | MathPhys Archive
i understand,,,thanks
How to draw the graph excuse me?? What apps is used?
Maple
You can use any graphical calculators, a lot are available nowadays
From the above graph, f(x), I am not understanding where the other plotted numbers are coming from being that x can be any number that is less than 2 or greather than or equal to 2 for the appropriate equation. However, I do understand the y-intercept of the equations can be used as a plotted point. Also, I am asking how can one identify which numbers are the limit?
Jalisa, I am not sure if I understood your question correctly. I guess that you are not sure how we obtain those values for the left-hand limit and the right-hand limit. They are obtained from the graph, and in fact we have done a similar example in class. For instance, to find the left-hand limit \(\displaystyle\lim_{x\to 2-}f(x)\), first take a point \(p\) on the \(x\)-axis that is less than 2 but close to 2. Plot the corresponding \(f(p)\) on the \(y\)-axis. Next take another point \(q\) on the \(x\)-axis that is less than 2 but closer to 2 than the previously chosen point \(p\). Plot again the corresponding \(f(q)\) on the \(y\)-axis. If you keep on doing this process, you will clearly see that those plotted values on the \(y\)-axis are getting close to 1. That way we find that \(\displaystyle\lim_{x\to 2-}f(x)=1\). The right-hand limit is found in a similar manner. Hope this helps.
Pingback: Calculus 1 Lecture 3: The Precise Definition of a Limit | MathPhys Archive
Why does f(5)=0?
I think you are mistaken. \(f(5)\) is not defined. You are seeing an open circle on the graph at \(x=5\). That means the function \(f(x)\) is not defined at \(x=5\). However, the limit \(\lim_{x\to 5}f(x)\) exists and the value is 4 from the graph.
Okay. Thanks!
I’m working on the 1.3 homework assignment and I’m not understanding part of number 3. I am able to find the value of each quantity, but I can not when it does not exist nor can I explain why it does not exists.
lim f(x)
x–>1
the book says this does not exist and I don’t understand why.
From the graph, we see that the left-hand limit \(\lim_{x\to 1-}f(x)=2\) while the right hand-limit \(\lim_{x\to 1+}f(x)=3\). Since their values do not coincide, \(\lim_{x\to 1}f(x)\) does not exist.
Okay. I understand now. Thanks!